TECHNOLOGICAL OFFER
Mapping of energy demand
Description
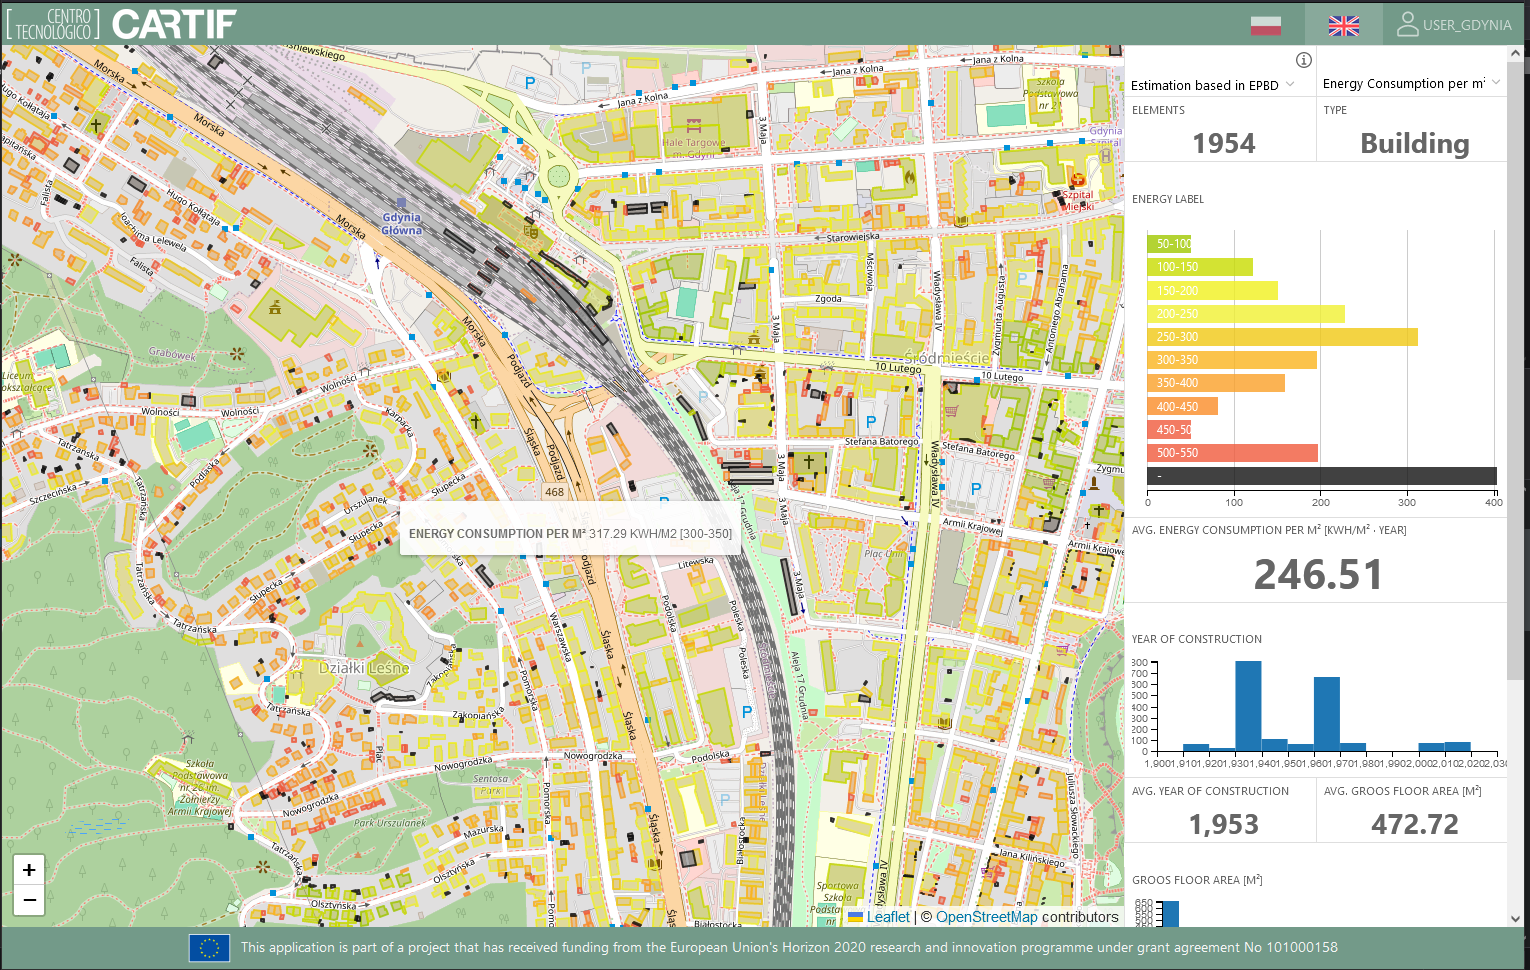
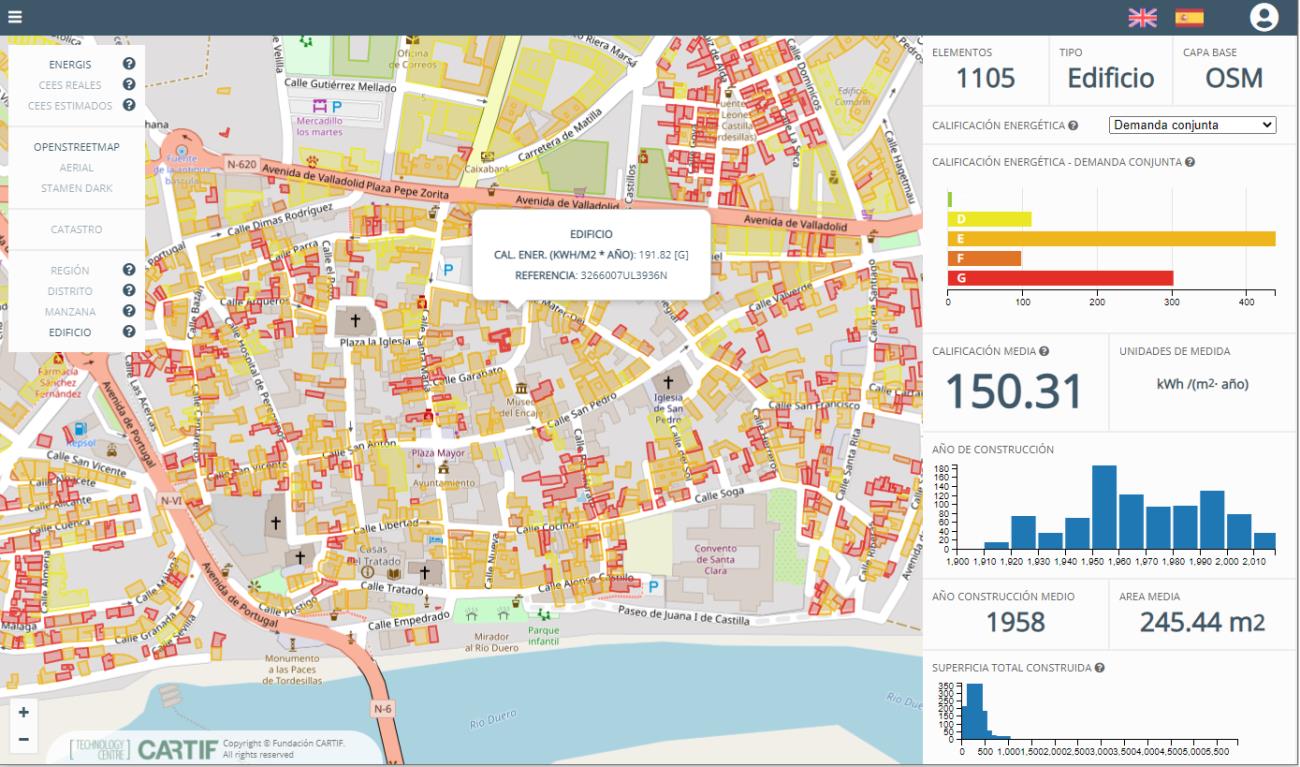
Estimation and visualization of the demand, consumption and CO2 emissions of buildings in urban or rural environments based on public information mainly from the cadastre and materials catalogs. The results can be visualized from any browser or with any free GIS software.
Our service:
- Extraction and processing the information from the cadastre.
- Automatic estimation based on different approaches:
- With a calculation engine based on the CE3X energy certification tool.
- Based on models generated with information from energy certificates extrapolating to buildings with different uses.
- With algorithms based on standards for the calculation of energy certification.
- Comparison of estimated data with data
- Georeferencing of the information and aggregated data by block and district.
- Realization of statistical analyses by building typology, year of construction, urban area or energy performance level.
Our value:
- We offer the energy demand mapping in buildings at municipal level, aggregating from the block level and supported by different approaches. With our service, we could cover any municipality in Spain and also almost European countries. Since most of the processes are automated, the times to provide results are much shorter compared to obtaining them with conventional methods, being remarkable the reduction when the number of buildings is large (districts, cities or even larger regions).
If your are interested you can see demos of the service in the following links:
Projects of reference:
- PLANNER, CCliMAP, ENERGIS, MATRYCS (R&D projects where GIS developments have been done for their visualization in maps).

